Titanic: First Kaggle Submission
The Titanic starring Leonardo DiCaprio and Kate Winslet was one of the first movies I have memories of. I remember being about 6 years old and my aunt leaving it on for the children. It was probably not a good movie for children, but hey we were occupied for the full duration of the movie. As kids we just watched whatever and did not really care about the content, well at least I didn't.So as you may know, other than being a great movie, the Titanic was also known to be the most luxurious passenger steamship in the world. And aside from being this marvelous ship, it was also deemed to be 'practically unsinkable'. The unsinkable Titanic definitely did not get to live up to her name. The Titanic tragically sank during her maiden voyage and with her brought down thousands of lives. The data from Kaggle will be used to predict whether or not a passenger will have survived. My question is if I boarded the titanic, would I have lived? or would I have died?
The Data
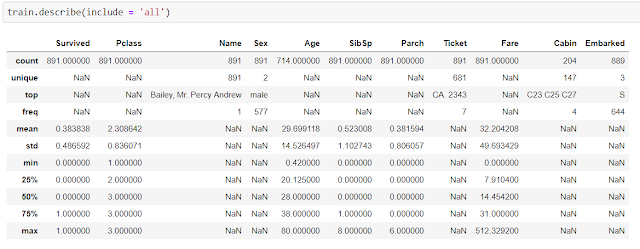
This is the data provided from Kaggle.com. We will need to manipulate this data so
that we can predict the likely hood of survival in the Titanic. What does each column represent?
And so I provided a table with the variables and its respective definition/keys.
Data Wrangling
 |
| Graph 1: Survival Rate vs. Title |
The original data was wrangled into a data table that looked like the one directly above.
Data Graphs
 |
| Graph 2: Survival Rate vs Sex |
 |
| Graph 3: Survival Rate vs. Age-Category |
 |
| Graph 4: Survival Rate vs. Ticket Prices |
By comparing the original ticket prices to today's approximate price. I categorized the ticket-fare into three different sections. Cheap tickets ranged from $0 to $12, Average tickets ranged from $12-30$, and the rest from $30+ I labeled expensive. Notice the trend between ticket price and survival rate.
 |
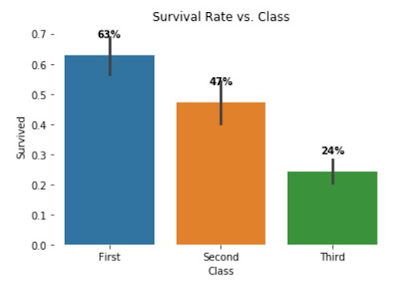
| Graph 5: Survival Rate vs. Class |
 |
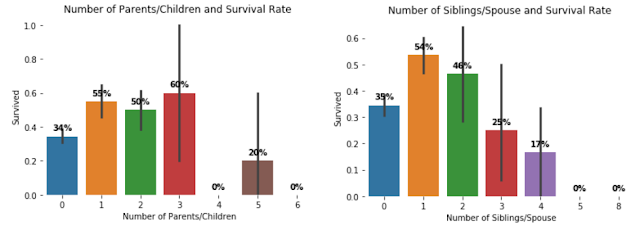
| Graph 6: ParCh vs. Surival rate Graph 7: SbSp vs. Survival Rate |
Machine Learning
After munging the data, the original data was separated into a test and a training group. By separating the data into two different groups I was able to predict whether or not a passenger on the Titanic was able to survive. The testing data was tested onto the trained data and fit into various machine learning models. The different models then predicted those who lived and those who died.
 |
| The Table above shows [10] models and the respective accuracy score |
 |
| The Table above shows the predicted values of survival using the Support Vector Machines Algorithm |
What is all this?
Results
The results show that for every female that was boarded on the titanic, they had a 74% chance of survival. This means that 3 out of 4 females survived and only 1 out of the 4 died. Males, on the other hand had a 19% chance of survival. Only about 1 out of 5 males survived, and the rest of them died.
Graph 3 shows the age-category and their likely hood of survival. Kids between ages 0-3 had the greatest chance of survival, while seniors, ages 65+ had the least. Just by looking at the age-category, if I was boarded on the titanic I would have had just a 33% chance of survival.
Graph 4 shows the survival rate between the fare prices. Those who had average priced tickets had double the chance of survival than those with cheap priced tickets. Those who had the expensive tickets had a 58% chance of survival as opposed to just 22% for the cheaper tickets. Graph 5 shows a similar trend. With the passengers in the first class having a 63% rate of survival as opposed to just 24% for the third class.
Graph 6 & 7, show the survival rates corresponding to the amount of boarded parents/children and siblings/spouses boarded respectively. Those who had 3 parents/children had the greatest chance of survival, which was at 60%. Those with 1 sibling/spouse had the greatest chance at 54%.
Out of the ten different machine learning models used, Support Vector Machines model had the highest accuracy rate at 83.76 and the lowest, Perceptron at 69.54%.
Discussion
From the data its clear that if you were female during the sinking of the titanic you had the highest chance to survive. However, other than being female there were other factors that could have determined your survival, such as your age, financial situation, and the number of people you boarded with. To create better results for the future groupings of the different classes, fares, and ages can be changed. The name/title column can also be added to the model. I can also remove the price of the ticket variable because some people may have had excess to cheaper tickets than others. The class variable seems to be suffice in determining the financial background of the passengers. In the near future, in order to get a greater accuracy score, more information about the different machine learning algorithm needs to be studied.
Did I die or did I live?
Hypothetically if I boarded the Titanic, I would have boarded with my mom and my brother. Because I currently do not make enough money, I would have resorted to buying cheap tickets and being in the third class cabins. And so...I would be dead.


Comments
Post a Comment