My mom has been thinking about retiring lately, and so she went to various real estate agents in order to find the house perfect for her. However, upon searching she gave up mid-way, complaining that the houses she wanted to buy were way out of her budget. A condominium with just 2 bedrooms and 1 bathroom went for over half a million dollars. How ridiculous... and then I thought why are these houses so expensive? I dug deeper asked myself what determines the price of all these houses?
I decided to go on Kaggle to find competitions similar to my question. I found the perfect competition, as it was advertised for beginners such as myself.
Although, the data is not about New York, it still gives insight to the question:
What determines the price of houses?
The Data:
Click here for the description of the data
Lets predict the House Prices in Ames, Iowa.

Just from the first five rows of the training set, we can see a lot of NaN values, which are values that are not available or was not filled in. We must fill in the data NaN values with the mean, mode, or just simply replace it with the word "None." But before filling in the values I want to explore the data a little more.
First I want to explore SalePrice, the target feature.
 |
| The original-SalePrice on the left-side is right-skewed so I take the Log function in order to unskew SalePrice as shown on the right |

From this function I can see that there are currently 38 numerical features and 43 categorical features in the training data set. This will be important because numerical values can be filled with either the mean or the mode. The categorical values can be filled with "None" or mode.
I want to look to see if there are any correlations or patterns in the data.
 |
| We see a pattern, the greatest number of houses sold is during the month of june & july. |
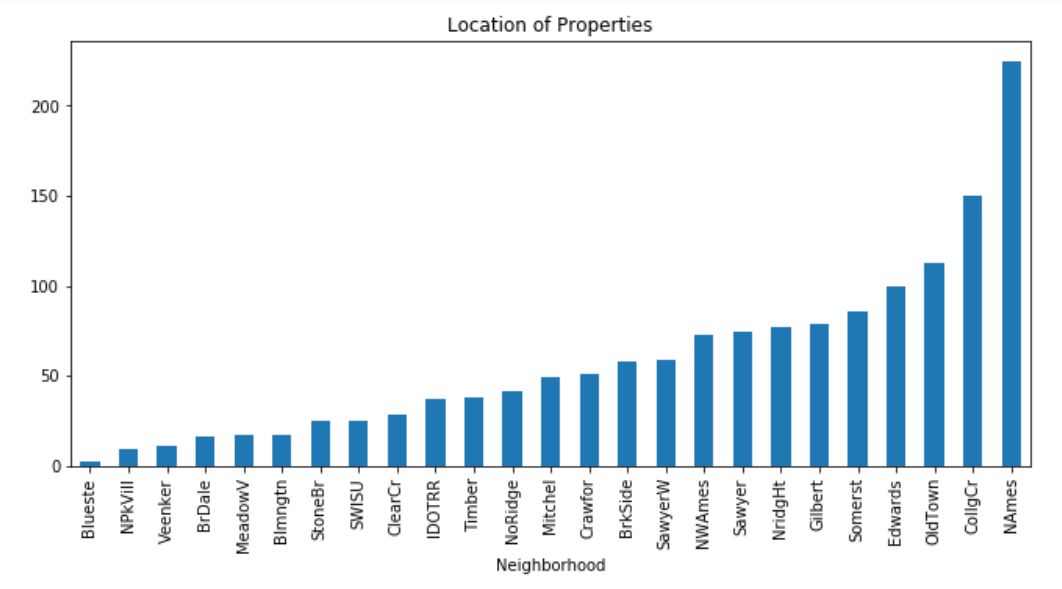 |
| We see something interesting in the neighborhoods as well, the greatest number of houses sold is located in NAmes. |
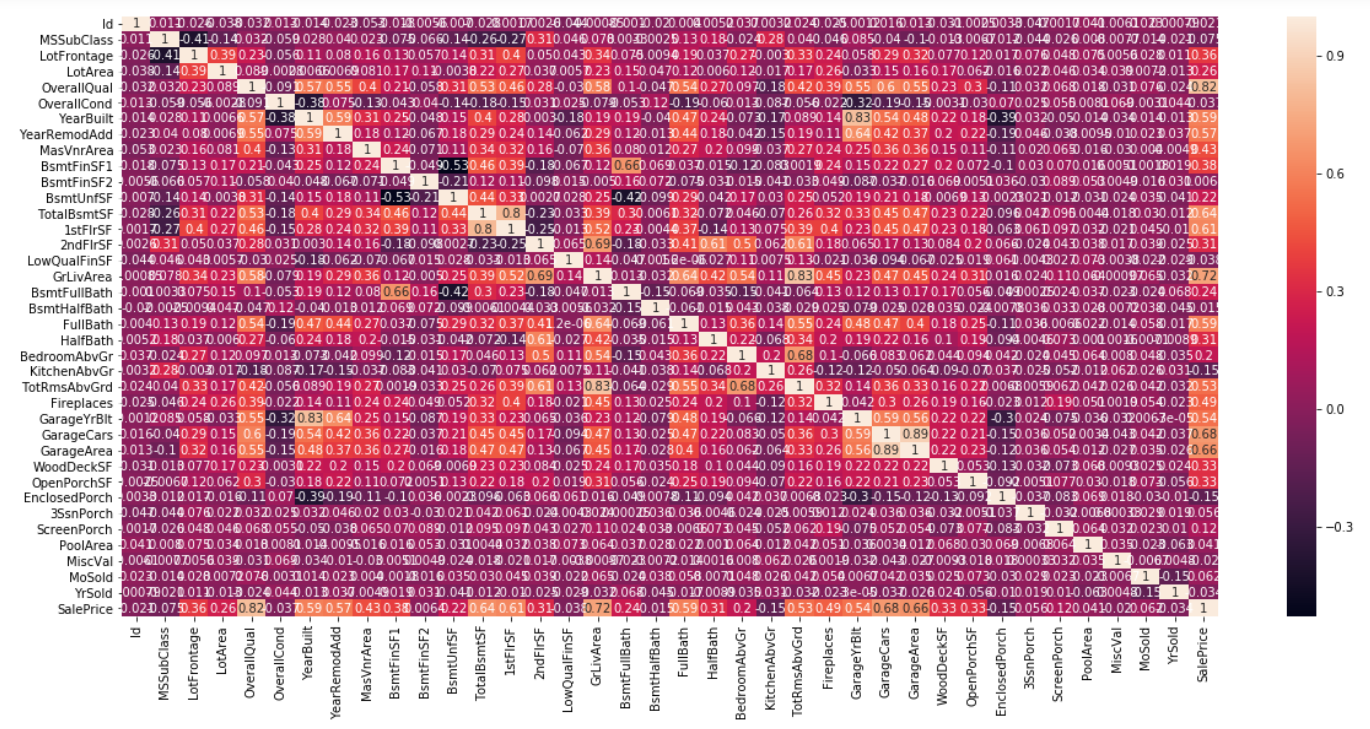
It may be hard to tell, but in the heat correlation graph, we can see that overall quality and living room area are the features that are most correlated with the sale price.
 |
| The graphs above show Sale Price vs GrLivArea The left graph shows that there are some outliers, and so the outliers are removed. Anything above 4,000 sqft is removed. |


they are converted into categorical data.
Using the functions below, the rest of all the missing data was filled.
 |
| There are now no missing data |
I used the ridge regression model to fit the data.
Ridge regression was used because that data set had multi-col linearity . That is the data had multiple features that had high correlations between two or more predictor features.

The best alpha was when the rmse was at the minimum which was around 10.

This graph shows that the overall quality & total square feet had the greatest impact on the price of the houses, which does make sense. When I am looking for a house and glance at the price, I will be looking at the quality as well as how much total square feet the house is.

After turning the dataframe into a csv. file the data was uploaded into Kaggle. The result of the submission is show below.

References
Kaggle: bsivavenu
Kaggle: serigne
Kaggle: apapiu
Comments
Post a Comment