 |
| Be it the lotto, a bet, getting checkmate, or destroying the nexus, who doesn't love winning? |
League of legends is a game that I used to play throughout high school and parts of college. I remember staying up many nights playing this stupid game. I say stupid, but I really mean addicting. I gave up smoking cigarettes, but I couldn't give up league. But what got me going was the competitive factor, where I kept wanting to win. Sometimes, I couldn't even sleep unless I destroyed the enemy teams nexus and got the victory notification.

How many hours could I have saved if I can predict the outcome of the games?
ALOT.If I knew a game was lost, I can simply forfeit and go on to the next game.
And so, i sought to find out how I can predict win.
The Data
As I was scrolling through kaggle's data section, I came across the perfect dataset to help me. Although I could have scraped the data from the League of Legends API, all the data was already in front of me.
The data I used was retrieved by bobbyscience of kaggle.com. The data and the description can be accessed here.
However, things to note is that the data came from skilled League of Legends players, which mean that they are 5% or higher in terms of skills ( I was in the top 5%, with a rank of diamond).
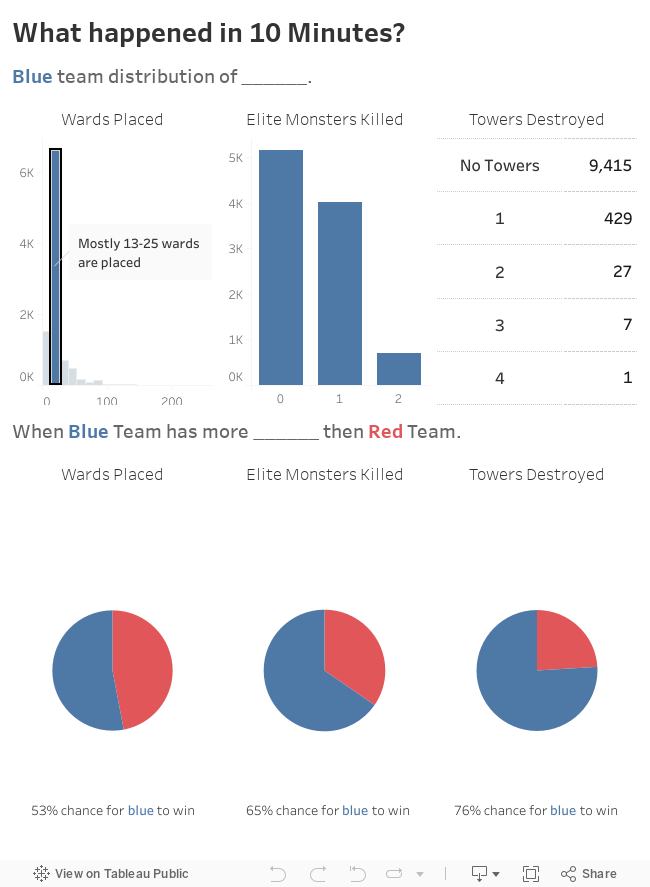
The data is also only stats for the first 10 minutes, which is helpful because I want to predict my games so that if I know I will lose, I can forfeit, and therefore save some time.
Exploring & Manipulating the Data
In order to predict whether a team will win or not we must first explore the data. You can see my work process and some initial exploring in my github link here.
There was a total of 9879 records and 40 feature,which were separated into blue team and red team.
For example, for every value of blue there was a value of red, such as redTotalGold & blueTotalGold.
 |
| Snippet of the list of columns in the original data frame. |
To reduce the numbers of features in the final model, I found the difference between the Red and Blue team for every feature. For example, I created a new feature such that the difference in kills = blueKills - redKills = diffblueKills. I also created a KDR (Kill Death Ratio) column but also implemented the number of assists. So KDR = (Kills * .5Assists) / Deaths .
 |
| New variables correlation matrix |
I used a correlation matrix to easily visualize the relationships between variables. From the correlation matrix I was able to find out highly correlated variables and removed them accordingly.
The features I used and kept, and the reasons are described more in my jupyter notebook.
 |
| Features used in the final model |
Building a Model
I chose to fit my data into a logistic regression model.
I chose a logistic regression model because my response variable is a binary one, and the parameter results are easier to interpret then any other model.
Using sklearn, I standardized the data, and split the data into a training and test set.
 |
| Confusion matrix and classification report |
The test data had a accuracy score of .7181 and the training had a score of .7204, which means that the model fit well.
I also found the odds_ratio of each variable by using numpy's exp() method, which is euler's number to the power of the model's parameters.
Results
 |
| Odds ratio for the model variables |
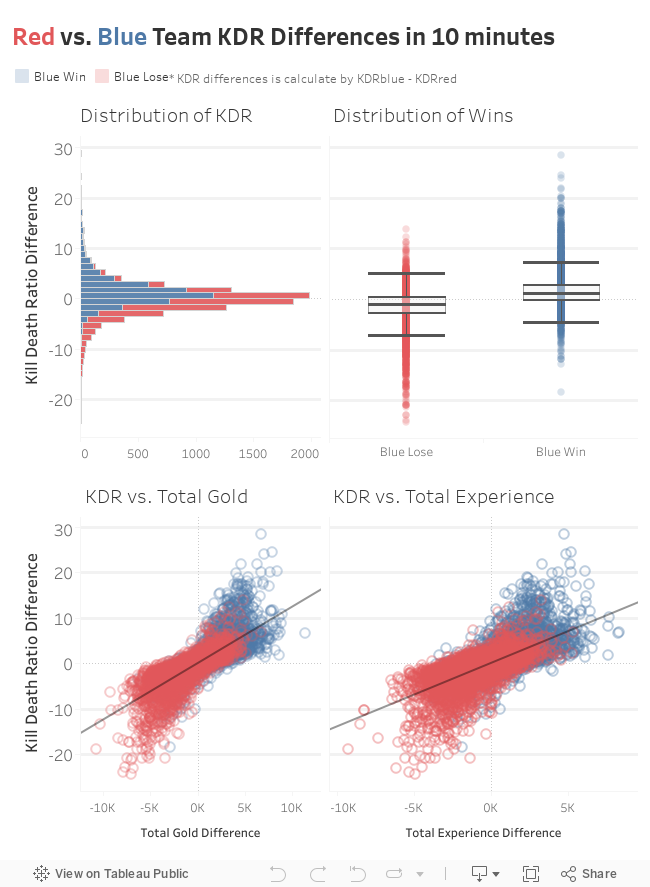
So from the model we can conclude that the difference in blue team and red team Kill Death (Assist) Ratio had the highest influence in determining whether a team will win. Per a unit increase in KDR difference in the 10 minute mark, the odds of winning for blue team increased by 2.18 times.
Limitations & Biases
There were several limitations when working with this data set. One limitation was that I did not have the variables that showed what champions the teams used. A champion is important in determining wins because certain champions fair better than others. Thus, the right combinations of champions can help determine a win before 10 minutes. Another limitation to the data is that we only have data up until the 10 minute mark, it will be beneficial if we also have a new variable such as time into the game.
There were also several biases in the data. Many outliers were present in the amount of wards placed, however, this maybe due to Riot Games(League of Legends) not differentiating wards between champion skills. Another bias is that the data only comes from the top 5% of players, which means KDR and Minion kills are inflated. And finally, confounding variables are also a source of bias, we are not truly able to predict wins, unless we can get more information which was discussed in the limitations.
In the future I can try out more models in order to improve the accuracy of predicting a win. I can collect more information from Riot Games' API, such as the players that played and the time stamps for each game. Next time I play I will make sure to play safe and farm hard.
https://www.kaggle.com/bobbyscience/league-of-legends-diamond-ranked-games-10-min
Game:
https://na.leagueoflegends.com/en-us/
GitHub:
https://github.com/yoonsunghwan
Tableau Visualization:
https://public.tableau.com/profile/justin.yoon#!/vizhome/lol_viz/Dashboard2
Conclusion
The team with the higher Kill Death Ratio in the 10 minute mark will have greater odds of winning the game. In order to keep a high KDR, the team has to try their best to not die. It is better to play safe in the early game and farm as many minions as you can.Sources
Data:https://www.kaggle.com/bobbyscience/league-of-legends-diamond-ranked-games-10-min
Game:
https://na.leagueoflegends.com/en-us/
GitHub:
https://github.com/yoonsunghwan
Tableau Visualization:
https://public.tableau.com/profile/justin.yoon#!/vizhome/lol_viz/Dashboard2
Comments
Post a Comment